
Editors Comments:
As a Canadian national I've been closely watching the Canadian real estate market for over 50 years.
Editor Lawrence skiing in the Italian Alps

In my early years I was caught up in recession there and learned my lesson the hard way after I bought a beautiful beachfront property and yacht just outside of Vancouver when business was booming.
The following recession caused me to lose everything.
It is like skiing in Whistler in Canada. I learned how to ski by falling on my butt and getting up until I got to the point I became a ski instructor.
Real estate long-term trends are easy to predict.
Real estate always goes up but when it goes up too fast it can drop 20 to 70% as it did during 2007 when I gave a prediction for the world's real estate markets to get out.
In 2009 Vancouver was one of my earliest recommendations. In fact, I bought there myself.
Sadly, I must share the news that my prediction is that there is going to be a bubble with many major markets in the world will also apply to Vancouver and perhaps most of Canada in 2022 and beyond.
In my professional opinion this is not the time to buy real estate in Canada.
Interest rates will head up to fight the worst inflation in decades.
The cost of mortgages will head up. Those who have variable rates will find that they cannot keep up with the payments and will be forced to sell.
Therefore, increased supply and less demand. The worst scenario for real estate.
by Wolf Richter • Dec 18, 2021 •
Home prices spike in a few cities, “pause” in some, drop in others. Vancouver prices are below August levels.
By Wolf Richter for WOLF STREET.
In an amazing development for the Canadian housing market where prices have relentlessly exploded higher – fueled by money printing and interest rate repression that started in March 2020 – prices in November didn’t explode higher in all cities, but only in a few, and “paused” in some, and declined in others. In the most hyped red-hottest housing market of them all, in Vancouver, prices were below the peak in August.
So maybe this is just a seasonal breather in those markets. But last year and for most of this year, there were no seasonal breathers in Vancouver or any of the other major markets, the whole thing just went exponential, fueled by the Bank of Canada that was printing money and repressing interest rates like there’s no tomorrow.
But this is tomorrow.
The Bank of Canada announced its first taper decision in October 2020, over a year ahead of the Fed. It let repos and short-term Canadian Treasury bills mature and run off the balance sheet without replacement. It ended other smaller purchase programs. In October 2021, it ended QE altogether, and is no longer adding to its holdings of Government of Canada bonds. And it has put rate hikes on the table.
Throughout this 14-month period since the taper announcement, the BoC has pointed at the excesses in the Canadian housing market that resulted from the BoC’s reckless asset purchases and interest rate repression.
And inflation in Canada has reached the worst levels since 1992, as measured by CPI in November (+4.7% year-over-year).
Total assets on the BoC’s balance sheet, as of Friday at C$498 billion, have been roughly flat since the end of October and are down 13% from the peak in March. 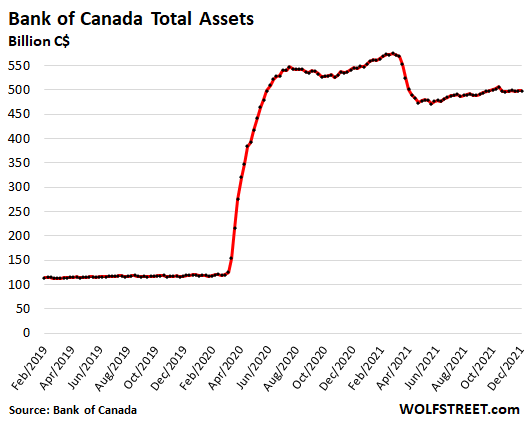
And here is how the housing market in Canada responded.
Greater Vancouver, one of the world’s biggest housing bubbles, “pauses.” House prices, after falling 0.4% in October from September, ticked up 0.4% in November and are down by 0.3% from August, according to the Teranet-National Bank House Price Index, released on Friday. This whittled down the year-over-year gain to 13.9%, the slowest such gain since March.
The BoC’s reckless monetary policies, starting in March 2020, performed a miracle on Vancouver’s housing downturn that had started in August 2018 and converted it into another exponential spike that is now broken: 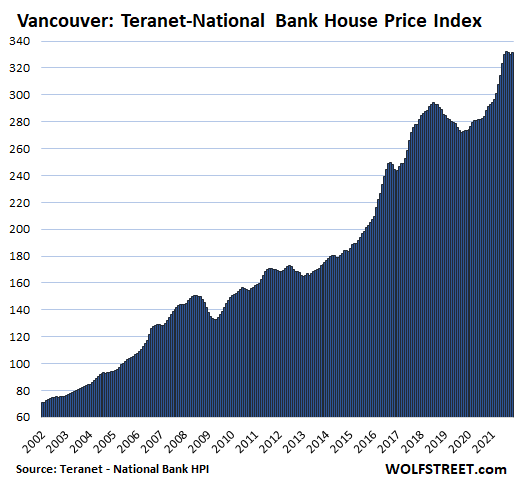
The Teranet-National Bank House Price Index uses the “sales pairs” method, similar to the Case-Shiller Home Price Index in the US, by comparing the price of a house that sold in the current month to the price of the same house when it sold previously. It thereby tracks the change in how many Canadian dollars it takes to buy the same house over time, and is thereby a measure of house price inflation.
The charts here are all on the same scale. As we go down the lineup, the markets with smaller two-decade house price increases have larger white spaces above the curve.
In the Greater Toronto Area, home prices rose 0.8% in November from October. The year-over-year increase remained at 16.3%, down from 18% in August: 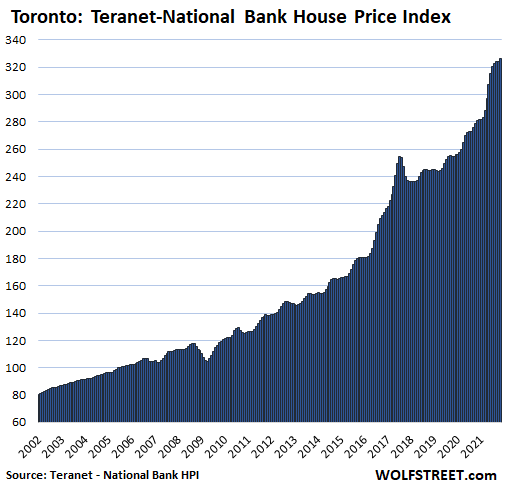
In Hamilton, Ontario, house prices rose 0.6% for the month. This is still a lot, but those month-to-month gains have come way down from the nuttiness earlier this year that topped out with a 3.8% gain in June. The year-over-year increase was whittled down from 30% in July and August to 25% in November. “Crazy” is the understatement of the century to describe this market. 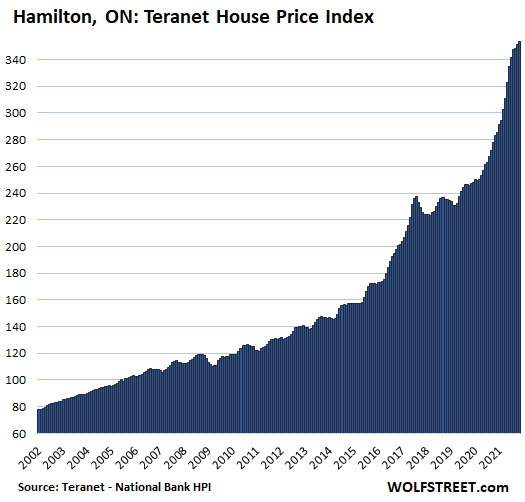
In Victoria, house prices rose 1.0% for the month, still steep, but down from the ridiculous 3.6% increase in June. This whittled down the year-over-year increase to 18.8%, from 21% in July. Prices had flattened from 2018 through June 2020, at which point the miracles of money printing did their job, producing an exponential spike: 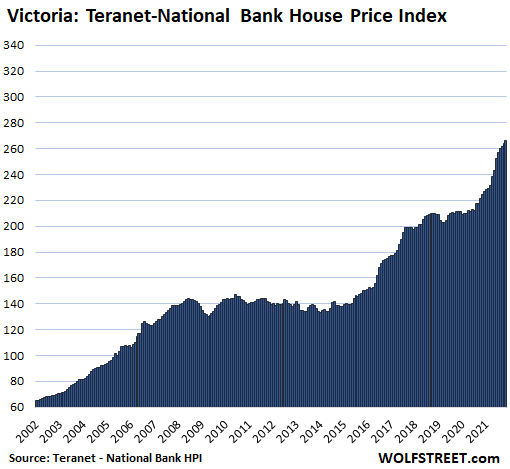
In Winnipeg, house prices remained flat in November for the second month in a row, which whittled down the year-over-year increase to 10.6%. The jump since the summer of 2020 occurred after prices had been roughly flat for seven years, following the prior housing boom that ended in 2013: 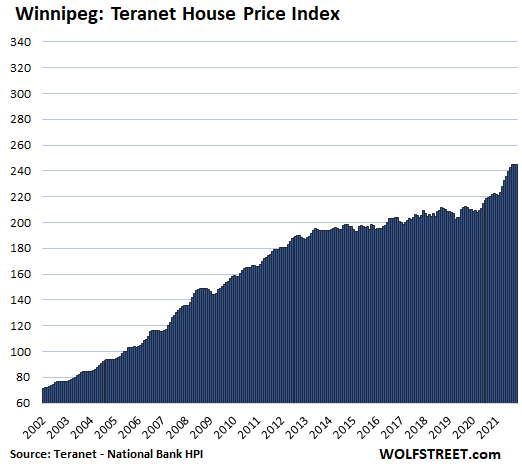
In Montreal, house prices were flat in November for the fourth month in a row, which whittled down the year-over-year gain to 15.5%, from the peak of 21.6% in August: 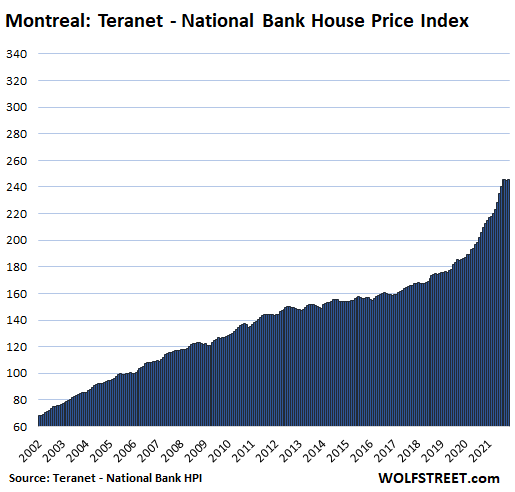
In Ottawa, house prices fell 1.1% for the month, the third month in a row of declines. This chopped the year-over-year gain to 18.0% from the peak of 28.9%: 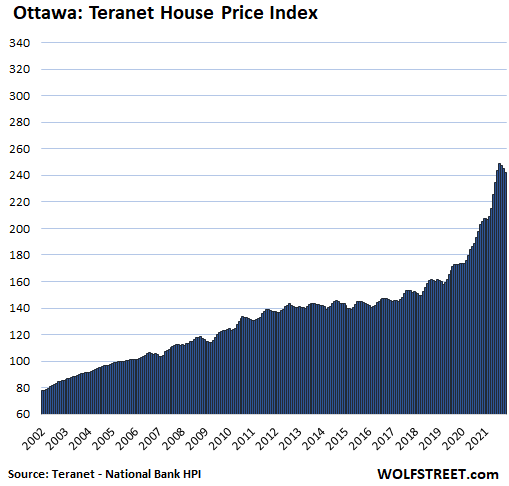
In Halifax, house prices rose 1.2% for the month, and while that is still a crazy increase, it’s down from an idiotic 5.4% spike in April. This whittled down the year-over-year gain to 29.8% from 33.4% in July, which is just nuts: 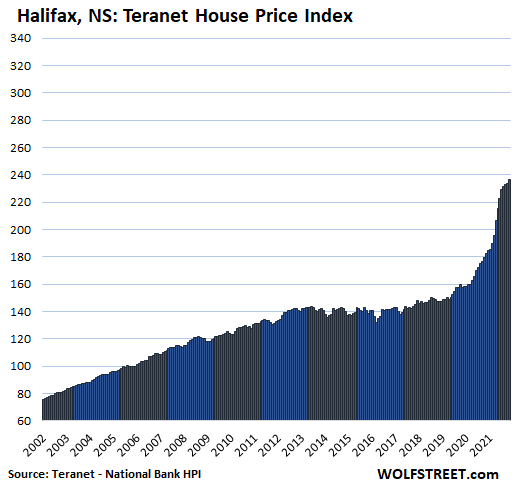
In Quebec City, house prices ticked up 0.3% for the month, which whittled down the year-over-year gain to 8.0%, the slowest gain since February: 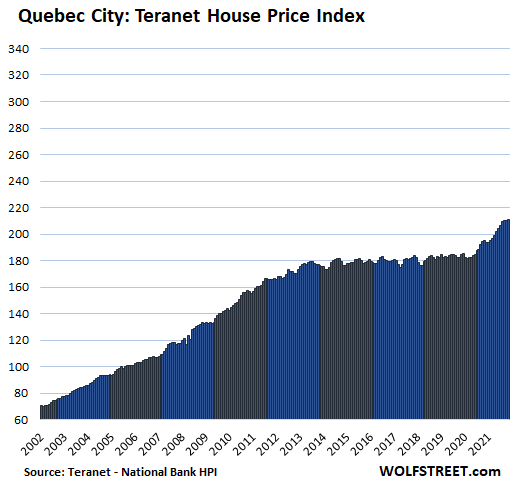
Calgary and Edmonton, Canada’s oil towns, had spectacular housing bubbles during Canada’s oil boom until the whole thing stalled in 2007. 14 years later, Calgary’s home prices are just a tad above 2007 levels while Edmonton’s remain below 2007 levels, despite the gains of the past 12 months, following the BoC’s money-printing.
In Calgary the index is up 8.3% year-over-year, and in Edmonton 4.8%. Edmonton was one of the cities where home prices fell in November (-0.3%).
But with house prices near where they’d been 14 years ago, the last two in the Teranet-National Bank House Price Index don’t qualify for the most splendid housing bubbles in Canada.
Enjoy reading WOLF STREET and want to support it? Using ad blockers – I totally get why – but want to support the site? You can donate. I appreciate it immensely. Click on the beer and iced-tea mug to find out how:


No comments:
Post a Comment